 let’s connect


Right now, an AI engine is answering a question in your market and naming a brand. Maybe yours, maybe a competitor’s.
Nothing in your analytics shows you which, and that blind spot is why GEO feels impossible to prove. Yet it is measurable, once you track the right signals.
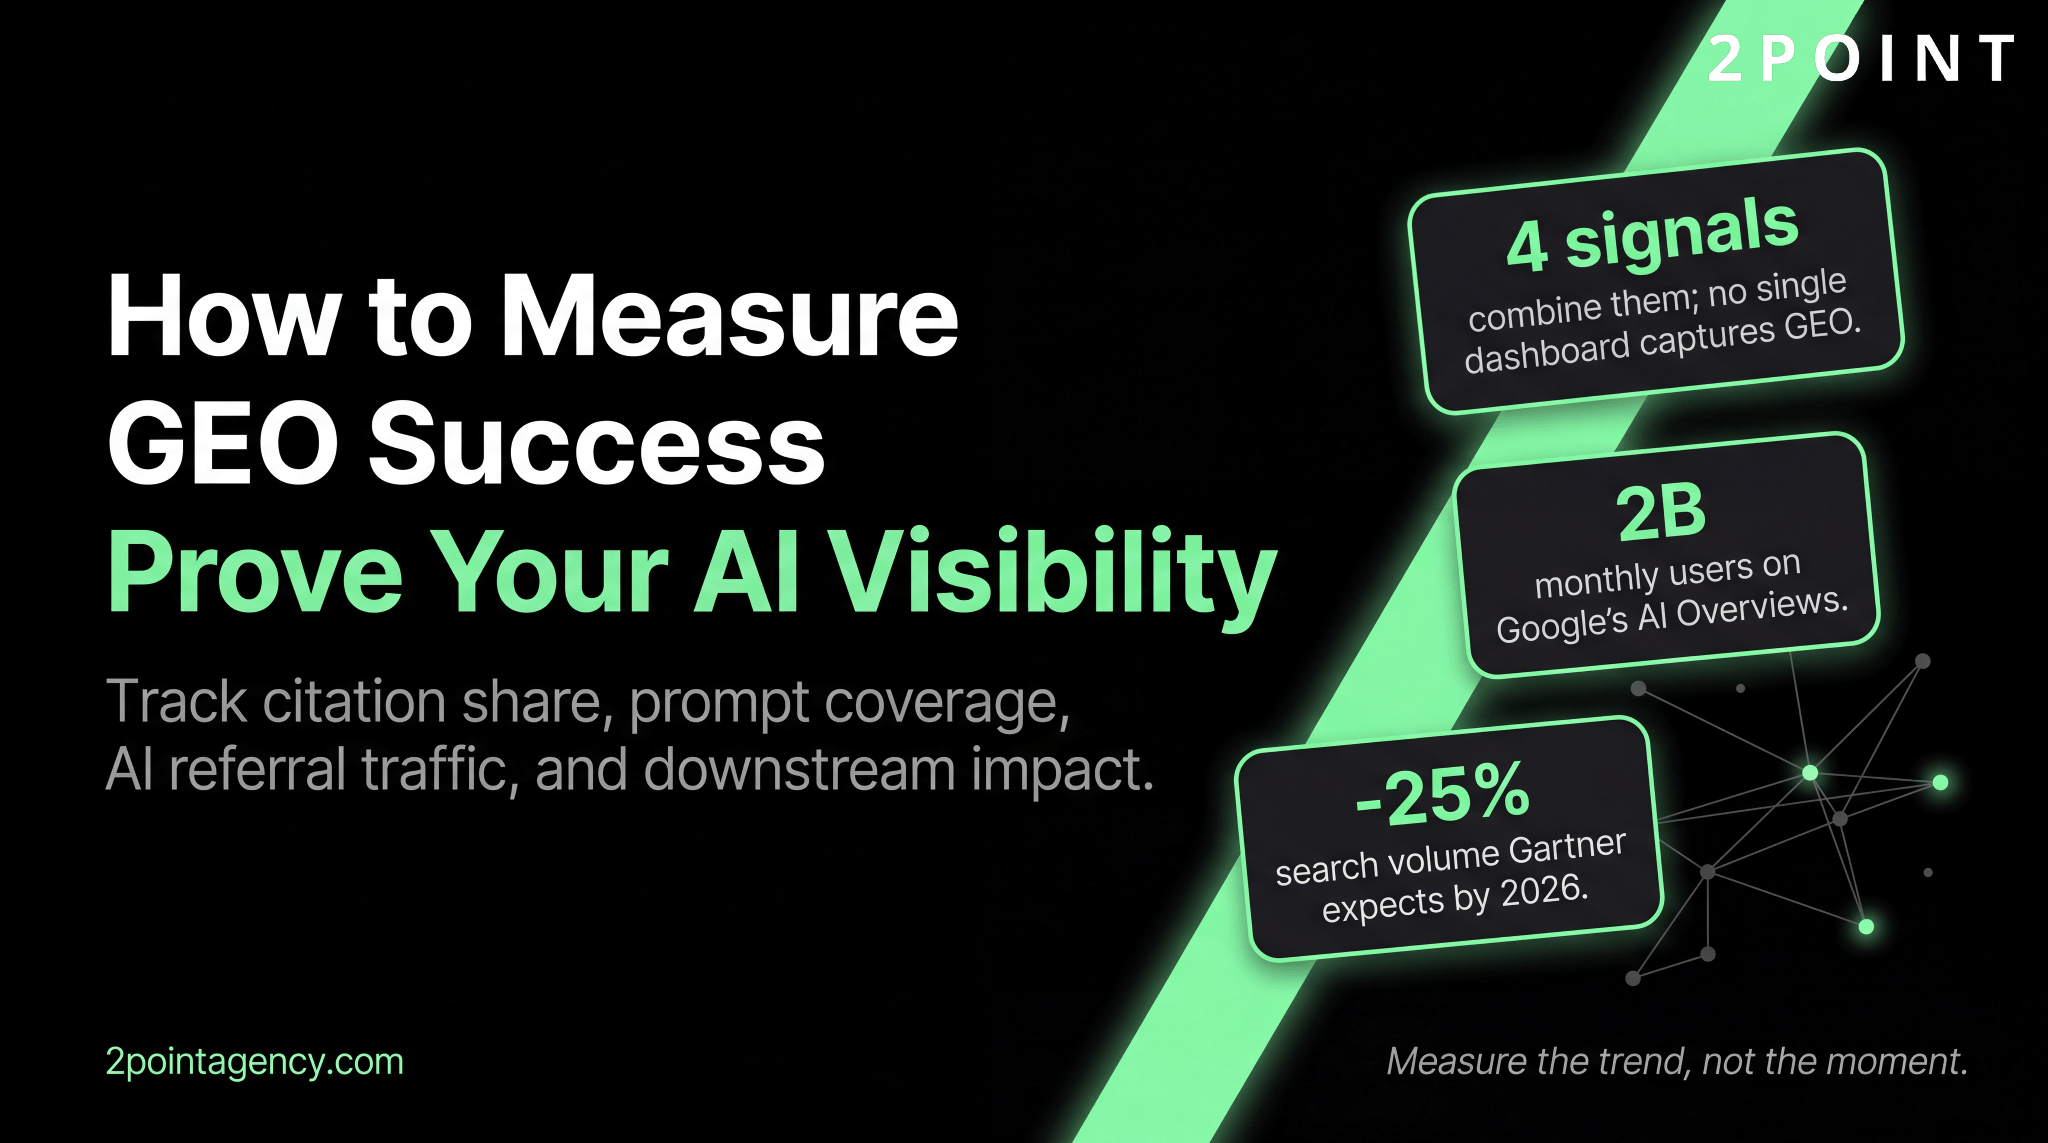
How to measure the success of generative engine optimization campaigns comes down to four things, citation share, prompt coverage, AI referral traffic, and downstream impact. At 2POINT, we build the frameworks that let clients prove their AI visibility to leadership. If you report on AI visibility, this is for you.
TL;DR: The Direct Answer
How to measure the success of generative engine optimization campaigns means tracking several signals together, AI citation share, prompt coverage, citation position and sentiment, AI referral traffic, brand mentions, and downstream impact like assisted conversions and branded-search lift.
No single dashboard captures generative visibility yet, so you combine these signals rather than chase one metric. Start with a baseline, then watch the trend over time.
Why GEO Is Harder to Measure Than SEO
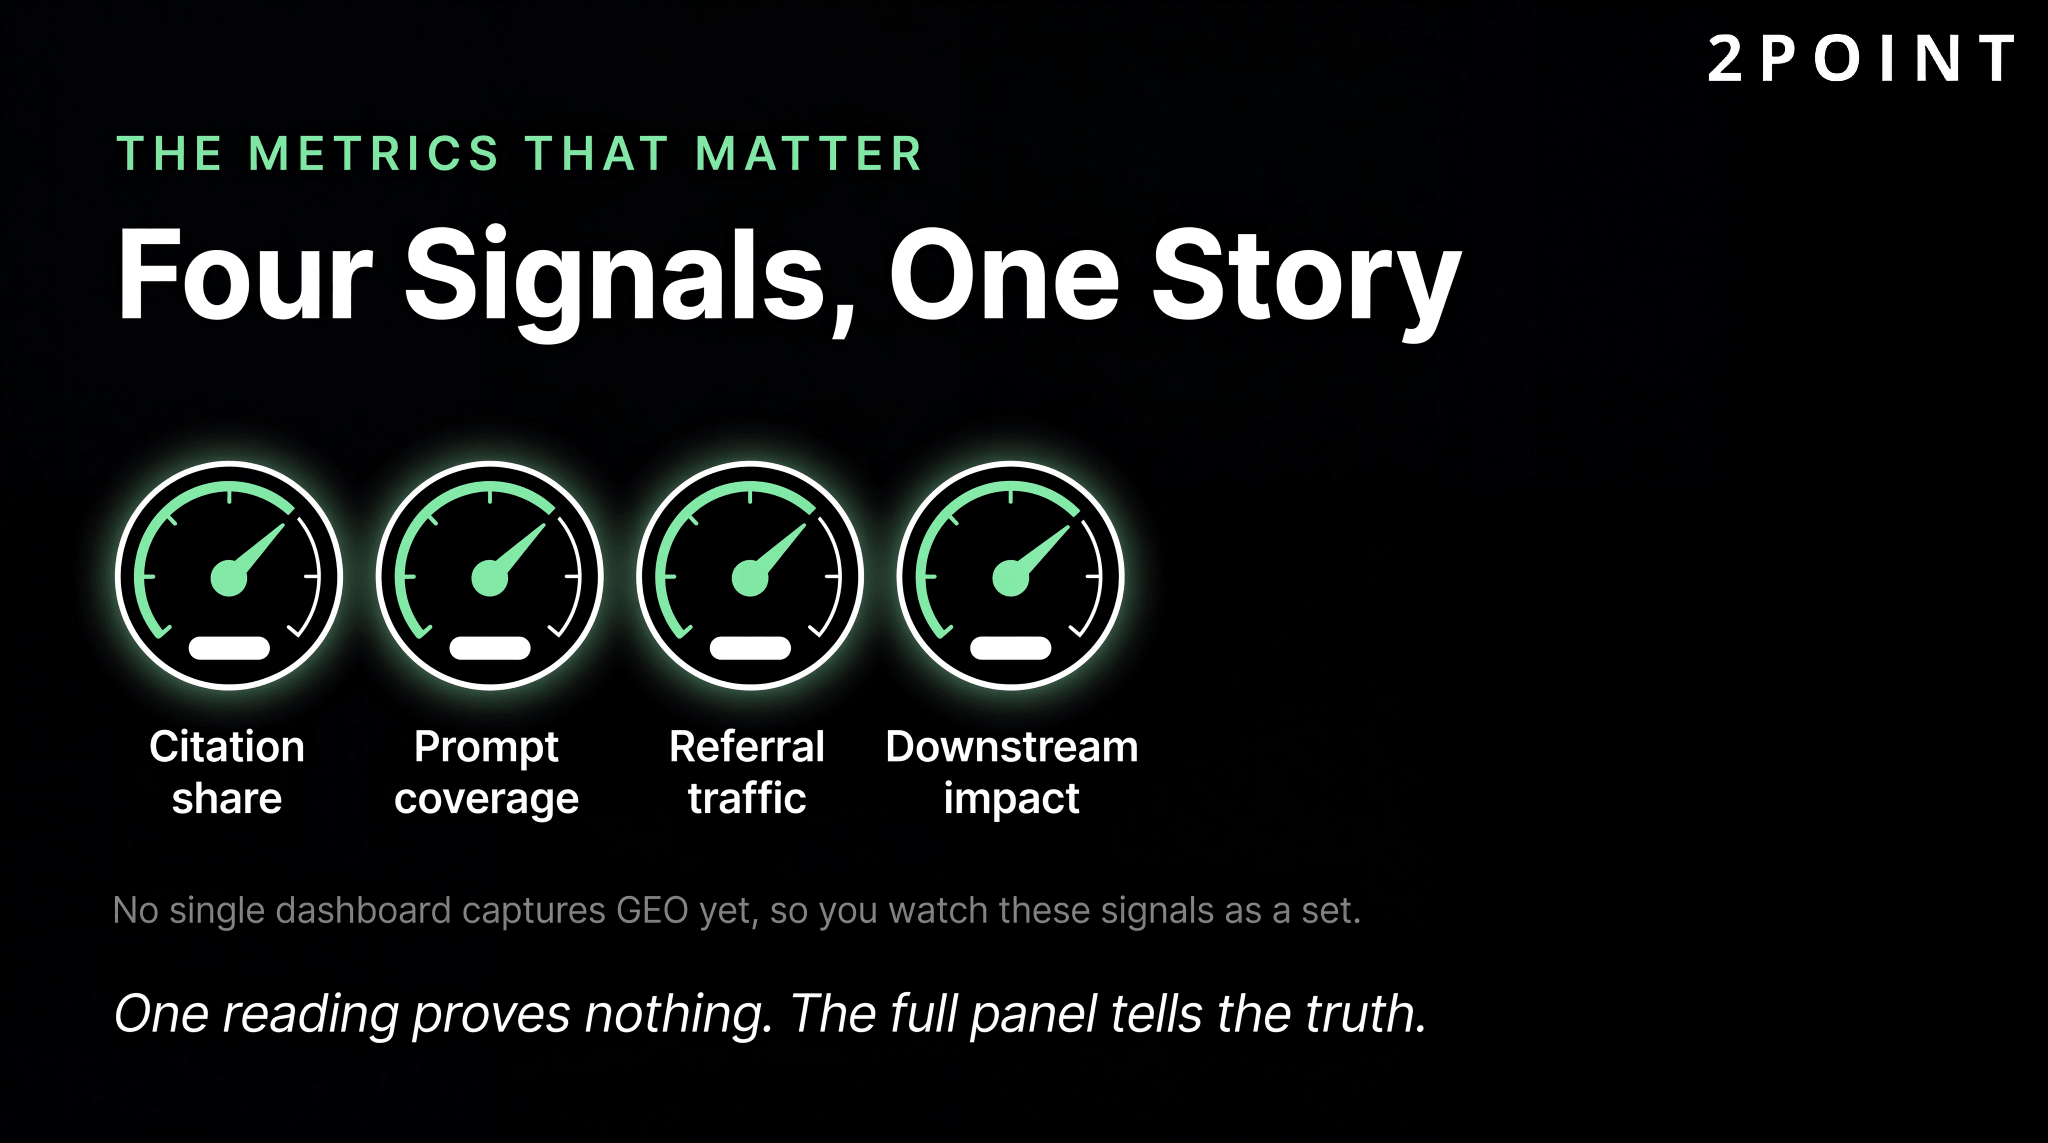
SEO hands you rankings, clicks, and impressions in one place. GEO gives you none of that out of the box. There is no unified dashboard, a citation does not always produce a click, and the same prompt returns different answers by engine, by user, and even by session.
That moving target is what trips up so many teams.
Cracking how to measure the success of generative engine optimization campaigns is less about finding a tool than building a repeatable method, one rooted in how engines actually choose what to cite. Get that method right, and the missing dashboard stops being a problem.
The GEO Metrics That Actually Matter
These are the GEO KPIs worth tracking. None stands alone, and together they tell the real story.
1. AI Citation Share (Share of Voice)
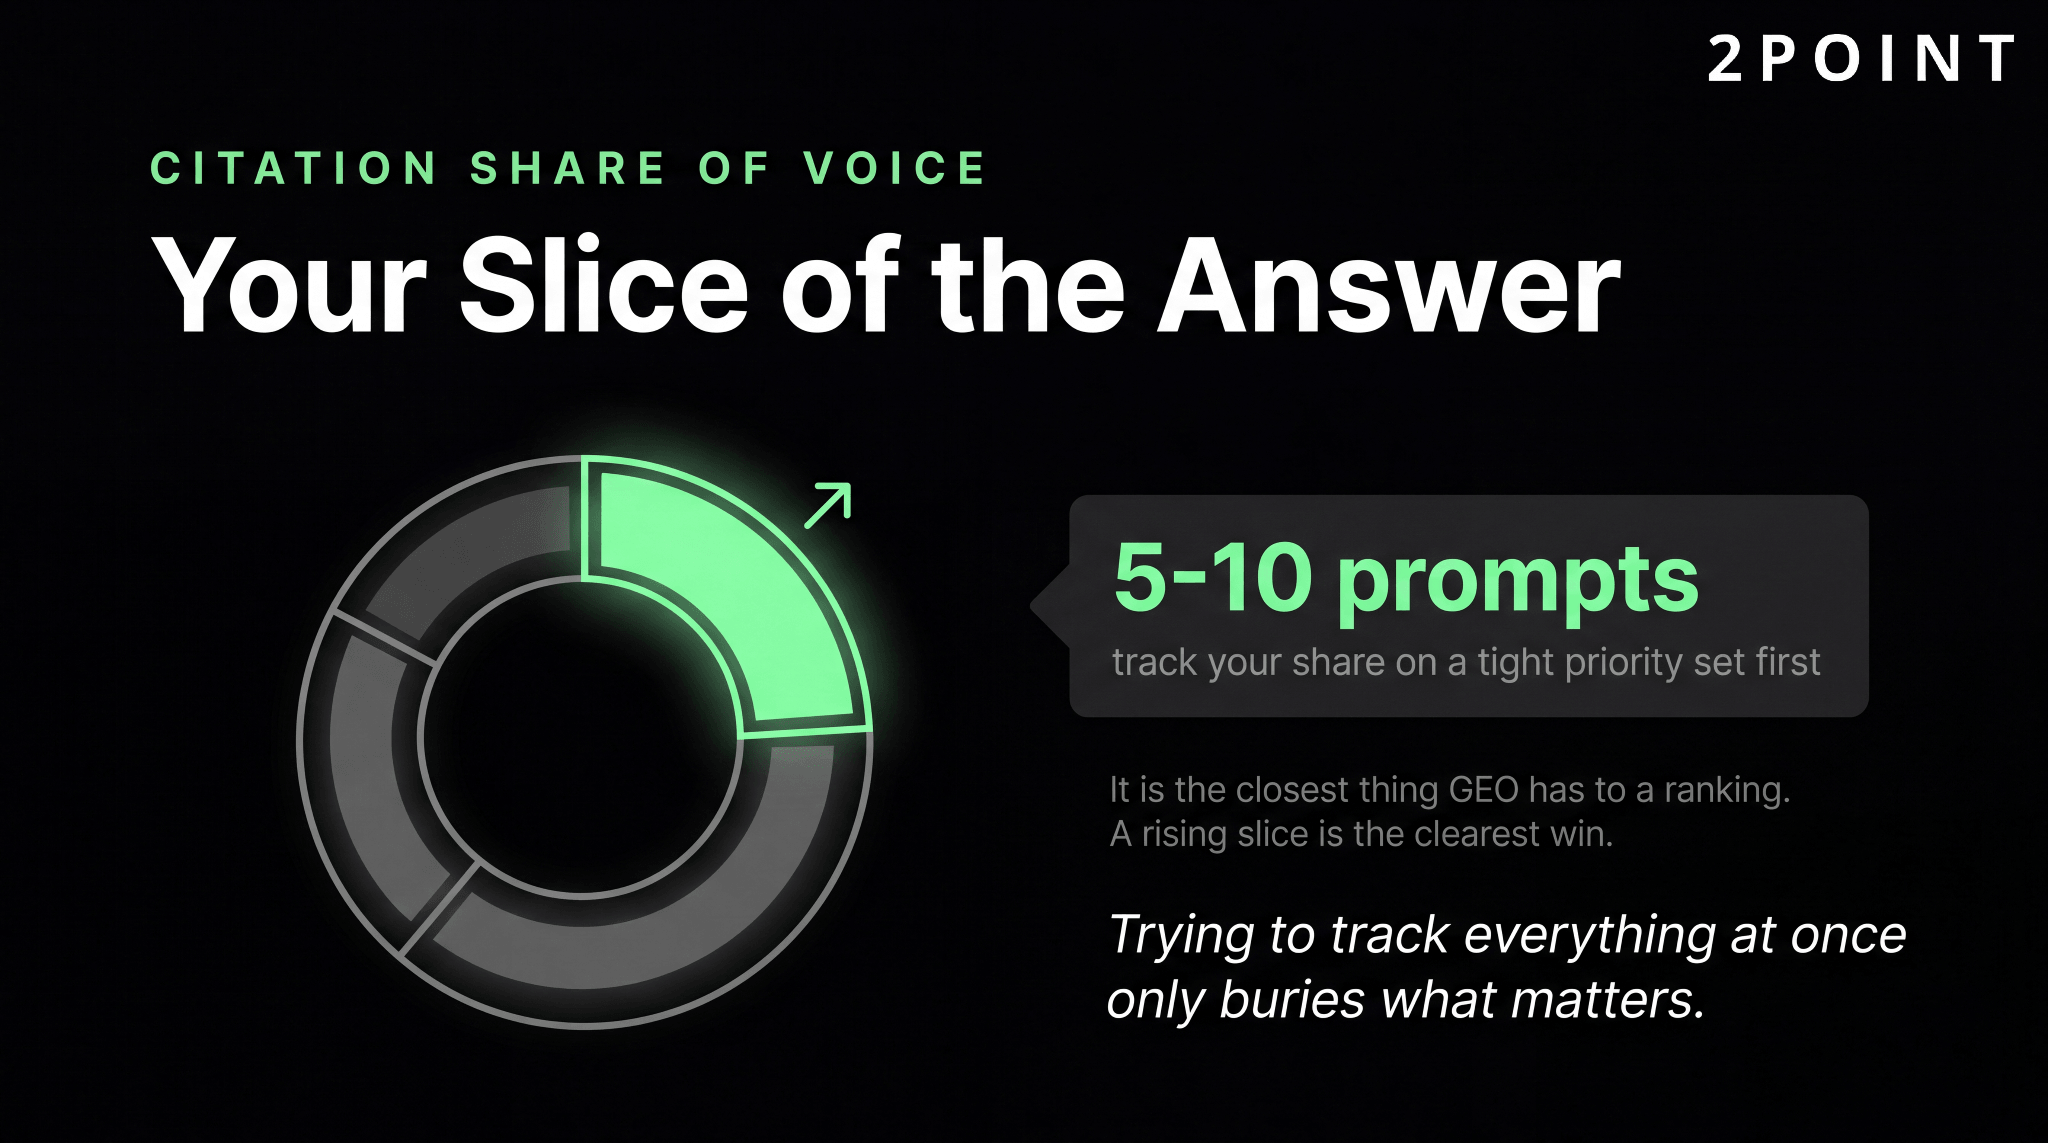
This metric tracks how often you get cited versus competitors for your target prompts.
Think of it as the closest thing GEO has to a ranking, and a rising share is the clearest sign you are winning. To keep the signal clean, pick five to ten priority prompts and watch your share on those first. Trying to track everything at once only buries what matters.
2. Prompt Coverage
Coverage measures the share of your target prompt set that cites you at all. Where citation share shows dominance, coverage shows breadth, and you want both climbing together.
Be careful, though, since broad coverage with low share means you show up everywhere but win nowhere. When that happens, the fix is depth over reach, so double down on the prompts you can realistically own.
3. Citation Position and Sentiment
This pair captures where you appear in an answer and how favorably you are framed. Being named first and positively beats a buried, lukewarm mention, so track tone right alongside placement rather than treating them separately.
For a workable read, sample around ten answers per prompt. It is rough, but it tells you quickly whether the engines treat you as a leader or an afterthought.
4. AI Referral Traffic
These are the sessions arriving from ChatGPT, Perplexity, and Gemini, which you can isolate in GA4 by filtering referral sources. For most brands the volume is still small, yet the trend is the part that matters as adoption grows.
To stop these visits from hiding inside generic referral data, build a custom channel or segment in GA4 so AI sources stand on their own.
5. Brand Mentions (Cited and Uncited)
Models sometimes name you without a link, which reflects recognition baked in during training rather than a live citation.
Track both kinds, because uncited mentions still shape how buyers perceive you long before they click. Better yet, an uncited mention today often turns into a cited one as your authority on the topic grows, so it doubles as an early signal of where your visibility is heading.
6. Visibility and Impressions on AI Surfaces
Where it is available, AI Overview impressions in Search Console show how often you appear on Google’s AI surface.
Treat these GEO metrics as directional rather than precise, because the reporting is still maturing. Pair them with your manual prompt log too, since Search Console only sees Google.
On its own it leaves out ChatGPT, Perplexity, and the rest of the field.
7. Downstream Impact
This is the business end of the list. Assisted conversions and branded-search lift connect AI visibility to revenue, and together they are how you prove generative engine optimization ROI to a skeptical CFO. That same case sits at the center of the wider work of LLM SEO, which ties this whole AI-visibility channel back to growth you can defend in a budget meeting.
How to Track GEO (Step by Step)
How to measure GEO is less about tooling than a routine you repeat. Here is a method any team can run.
- Build a target prompt set of 20 to 50 real questions your buyers actually ask AI.
- Test that set across ChatGPT, Perplexity, Gemini, and Google AI on a fixed schedule.
- Log each result, noting whether you were cited, your position, the sentiment, and which competitors got named.
- Set up GA4 referral tracking to capture AI-sourced sessions rather than lose them in generic referral data.
- Automate with a tool once the manual log gets too heavy to keep up by hand.
The discipline matters more than the steps themselves. Run the same prompts the same way each cycle, because consistency is what turns scattered checks into a trend you can actually report.
Keep it all in one shared sheet, too, so anyone on the team can read that trend at a glance.
Tools for Measuring GEO
You can start entirely by hand, then graduate to software once your prompt set outgrows a spreadsheet. Dedicated platforms earn their place by automating the prompt testing, citation logging, and competitor tracking that eat your time when you run them manually across several engines.
Which one fits depends on your scale, since the field runs from affordable monitors to full enterprise suites. You can see how the leading trackers stack up before committing to any of them.
Still, there is no rush. Pick a tool only once manual tracking starts costing you real hours every week.
Generative Engine Optimization Statistics to Benchmark Against
A few current numbers give you something to benchmark against. Start with the direction of travel. As reported by Gartner, traditional search volume is set to fall 25% by 2026 as buyers move to AI assistants, and Google’s AI Overviews already reach two billion monthly users.
Adoption backs that up. A Pew Research Center survey found that 34% of US adults have used ChatGPT.
On the optimization side, the original GEO research paper showed the right changes can lift a source’s visibility by up to 40%.
Use these generative engine optimization statistics as benchmarks, not targets. Your own numbers will swing with your niche, since that same paper found the gains vary widely by domain.
How Often Should You Measure GEO?
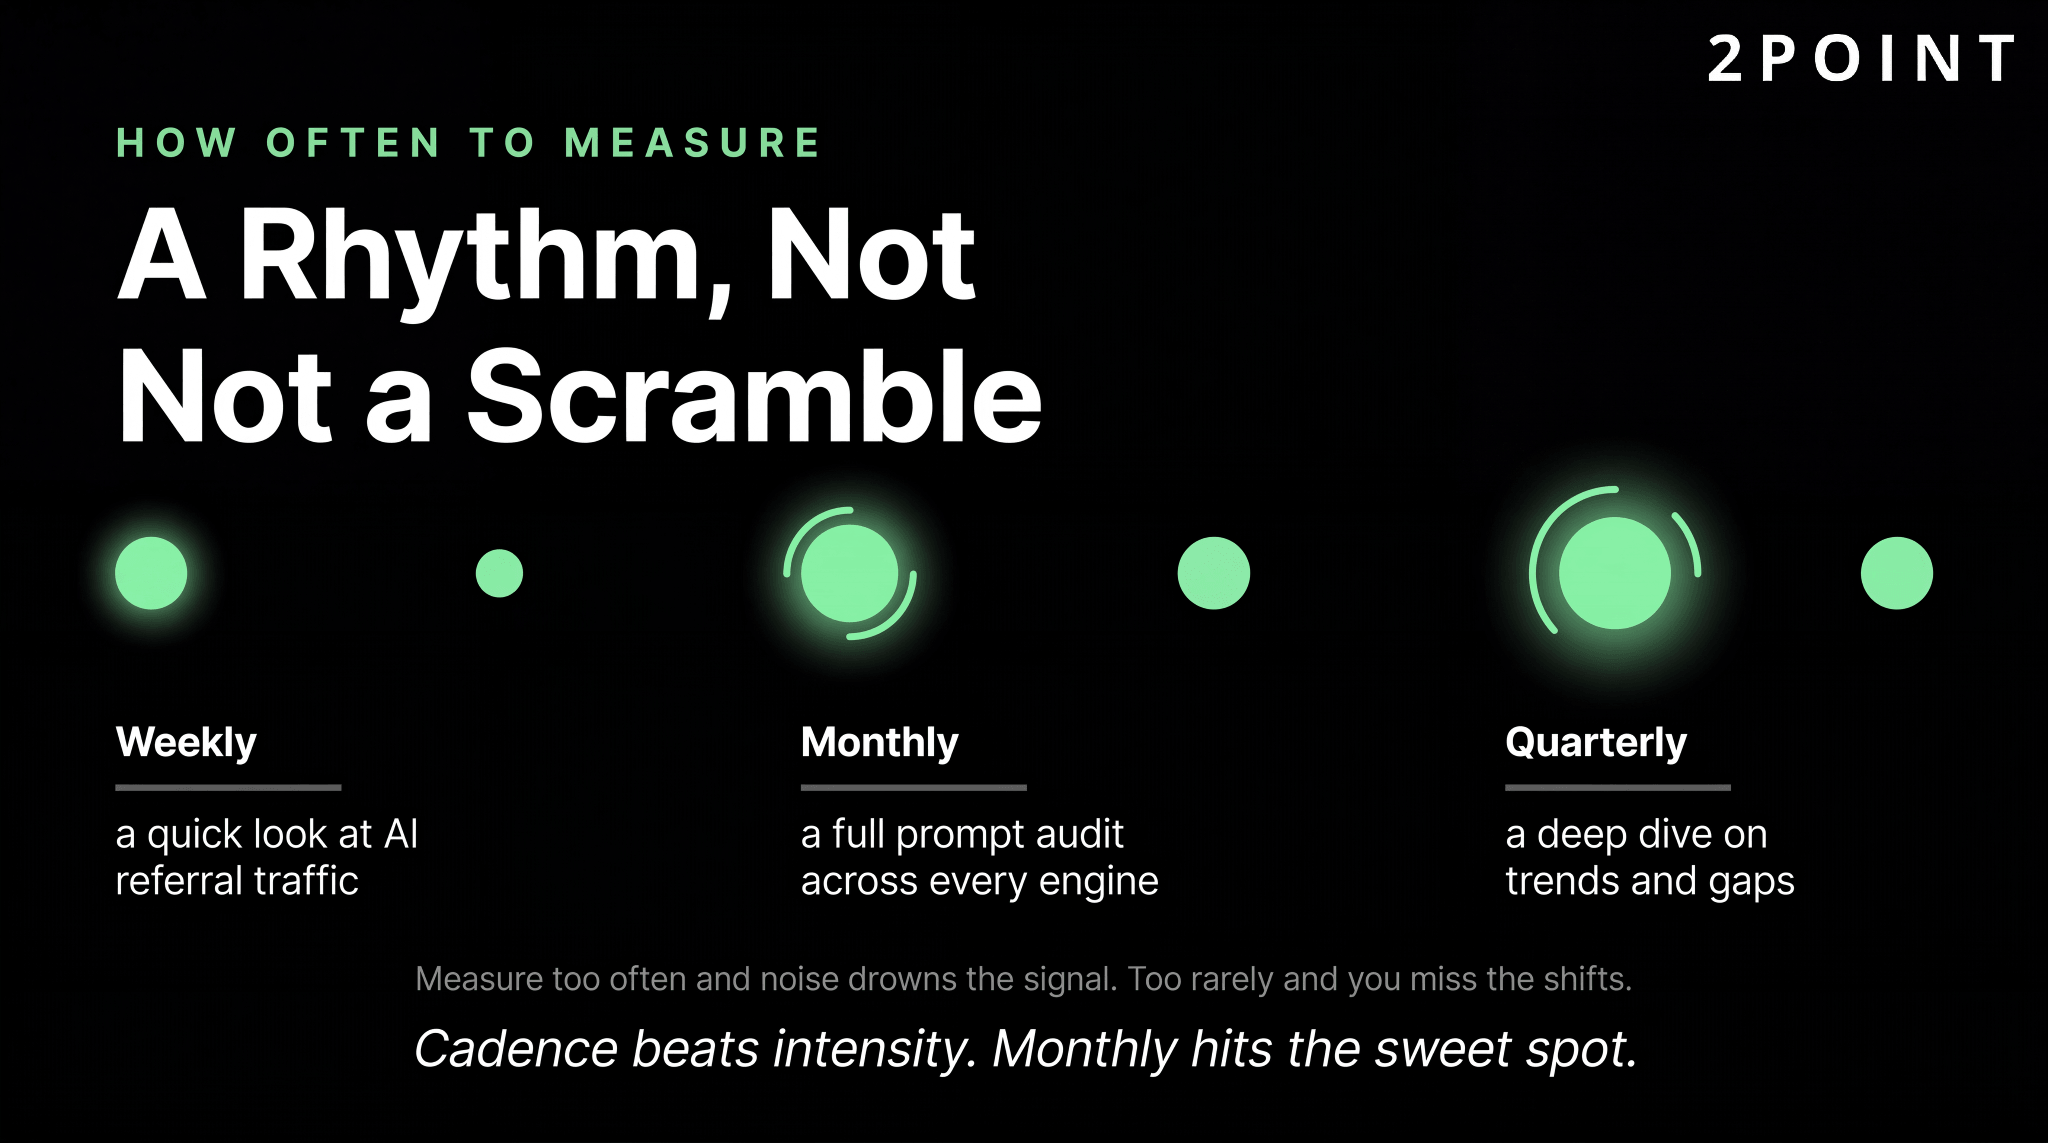
Cadence beats intensity. For most teams, a simple rhythm keeps the signal clean without eating your week.
- Monthly, run a full prompt audit across every engine.
- Weekly, take a quick look at AI referral traffic in GA4.
- Quarterly, go deeper on trends, competitors, and content gaps.
The logic behind that spacing is straightforward.
Measure too often and session-level noise drowns the signal, yet measure too rarely and you miss the shifts that matter. Monthly hits the sweet spot for your headline numbers, while the weekly and quarterly checks catch what a single cadence would leave out.
Turning GEO Data Into Action
Data only matters if it changes what you do. When your citations rise, document what worked and repeat it on the next topic. When they drop, find the cause before you react, whether that is a stale stat, a competitor’s fresher page, or a structural change on your own.
Then match the fix to the cause, refreshing the content, restructuring the page, or rebuilding the authority behind it.
The strongest programs close this loop every month. They treat each drop as a diagnosis rather than a verdict, because most are fixable once you know what slipped. If you would rather hand both the measurement and the fixes to a team, managed SEO is built to map those gaps and ship the work.
GEO Measurement Mistakes to Avoid
A few traps quietly distort your reporting. These are the ones worth watching for.
- Tracking only one engine, usually ChatGPT, which hides how you show up across Perplexity, Gemini, and Google AI.
- Ignoring uncited brand mentions, even though they still build the recognition that leads to citations later.
- Expecting AI citations to convert to traffic one to one, when most of the influence happens without a click.
- Running with no baseline, which leaves you unable to prove any change actually happened.
Steer clear of all four, and your GEO reporting turns into something leadership can actually trust and fund.
Can You Prove Your GEO Is Working?
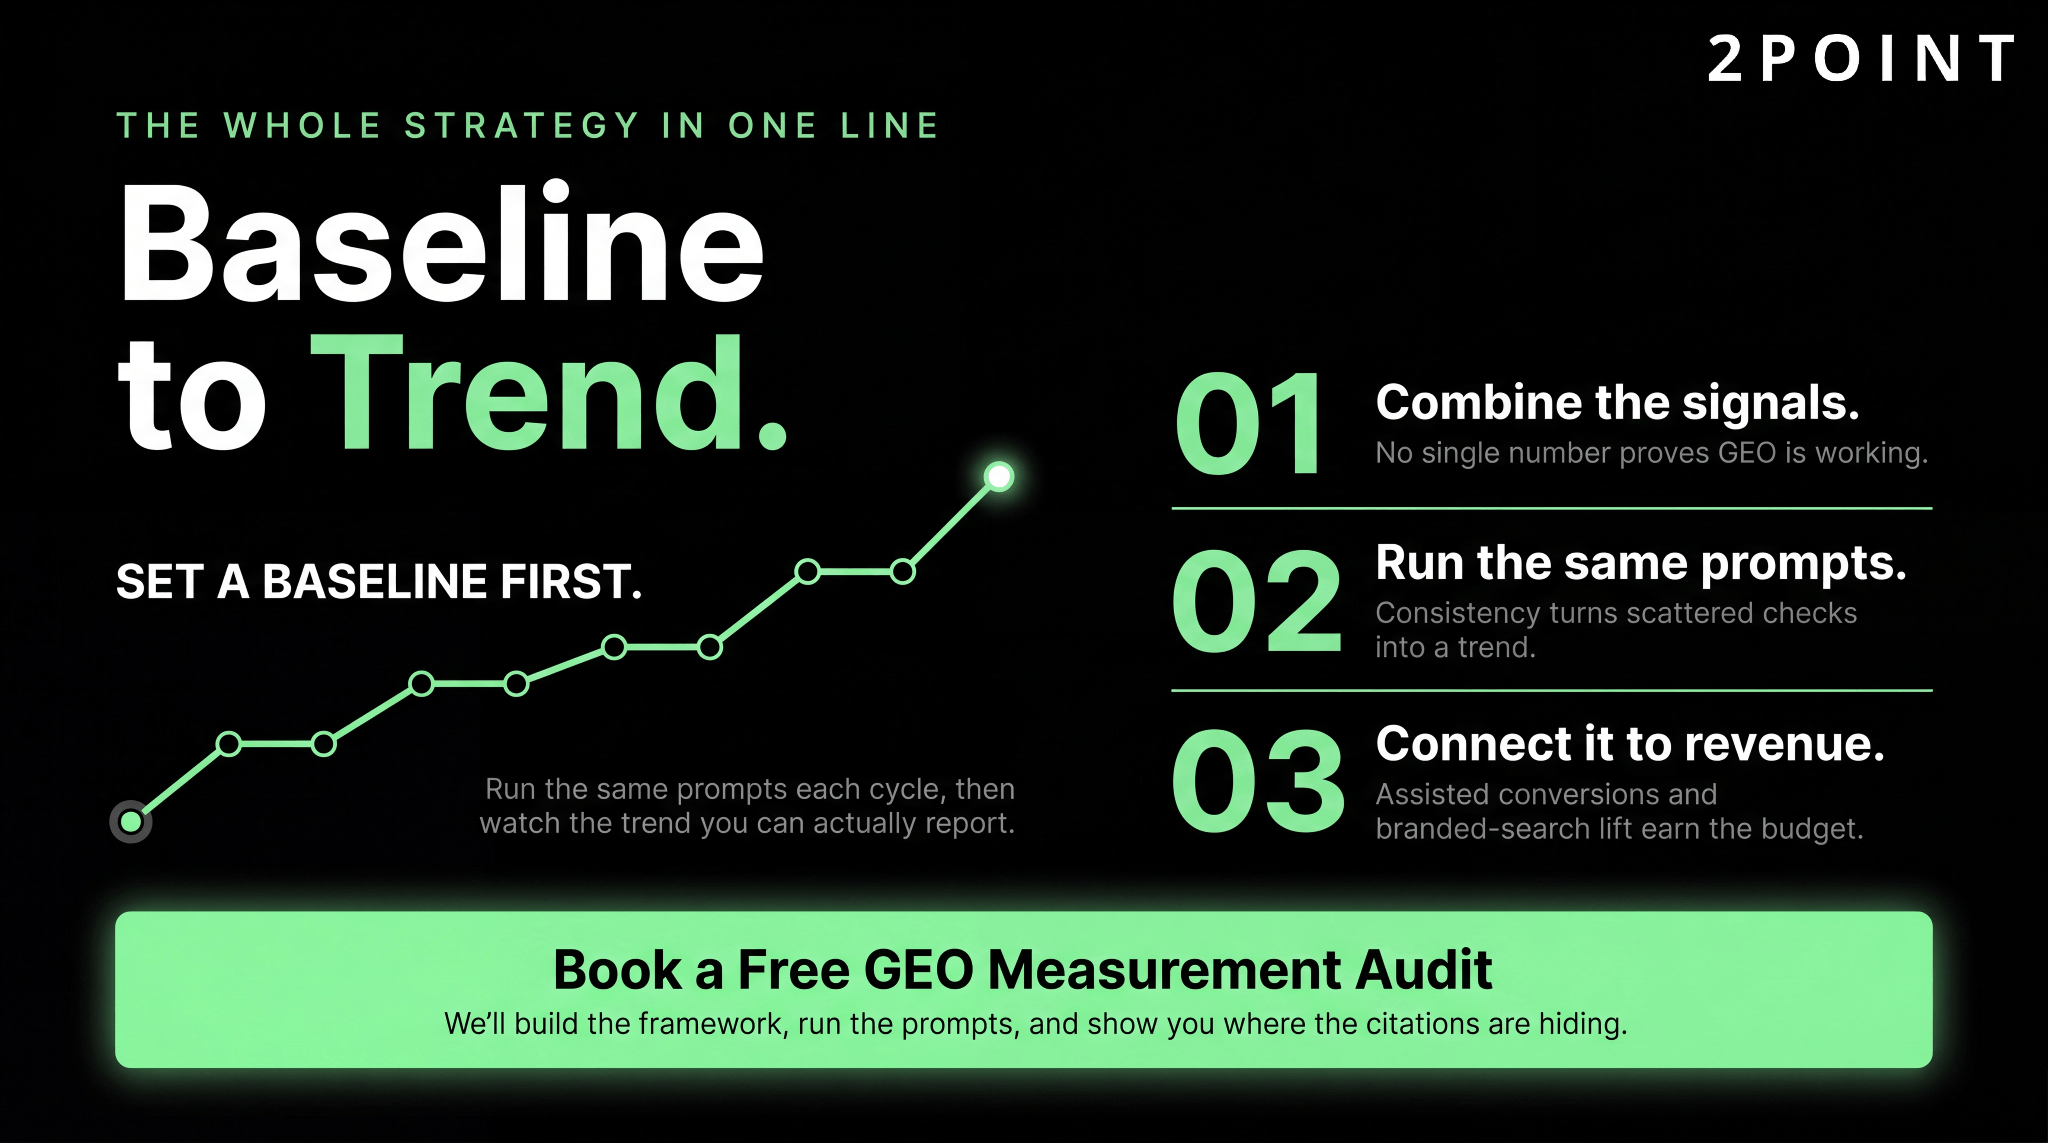
Measuring GEO is less about one perfect number than a combined view of citation share, prompt coverage, AI referral traffic, and downstream impact.
Build a baseline, run the same prompts each cycle, and connect those signals to revenue so the channel earns its budget. That discipline is the real answer to how to measure the success of generative engine optimization campaigns.
When you want it handled, our managed SEO team runs it as part of the multi-channel marketing that turns visibility into growth.
FAQs
How do you measure GEO success?
You combine signals. Knowing how to measure the success of generative engine optimization campaigns means tracking citation share, prompt coverage, position and sentiment, AI referral traffic, and downstream impact together.
No single number proves GEO is working, so build a baseline and watch the trend across all of them over time.
What are good GEO KPIs?
The core GEO KPIs are AI citation share, prompt coverage, citation position and sentiment, AI referral traffic, brand mentions, and downstream impact metrics such as assisted conversions. Start with citation share as your headline metric, then layer the others in.
Together, these GEO metrics show both visibility and business value.
Can you track ChatGPT citations?
Yes. You can check manually by running your target prompts in ChatGPT and logging whether you are cited, or automate it with an AI-visibility tool. Because answers vary by session, test the same prompts on a schedule and track the trend rather than reading too much into any single result.
Does GEO drive measurable traffic?
Some, and it is growing, though most value is not a direct click.
AI referral traffic from ChatGPT and Perplexity is still small for many brands, so generative engine optimization ROI shows up more in assisted conversions and branded-search lift than in raw sessions. Track both to see the full picture.
How long before GEO shows results?
It varies. Structural fixes can surface in AI answers within days, while authority-driven citation share builds over months. Expect early movement in one to three months and a clearer trend by six.
Knowing how to measure GEO matters from day one, since a baseline lets you prove the slow, compounding gains.